Case Study: pview
Why I built this
I was working on a game server and making optimizations, and I wanted to actually see how much each change moved the needle on that one process. htop and Task Manager didn’t refresh often enough to show the difference, and they both want to show me the whole system when I only cared about a single process.
It was also a chance to learn Rust. pview is my first Rust project, so it’s part tool I needed, part excuse to finally get my hands dirty with the language.
The problem
Full-system monitors like htop show everything at once. If you only care about one process’s resource usage over time, you end up hunting for one row in a list that keeps reordering itself out from under you, and a one-second or slower refresh smooths over exactly the small changes you’re trying to see.
The approach
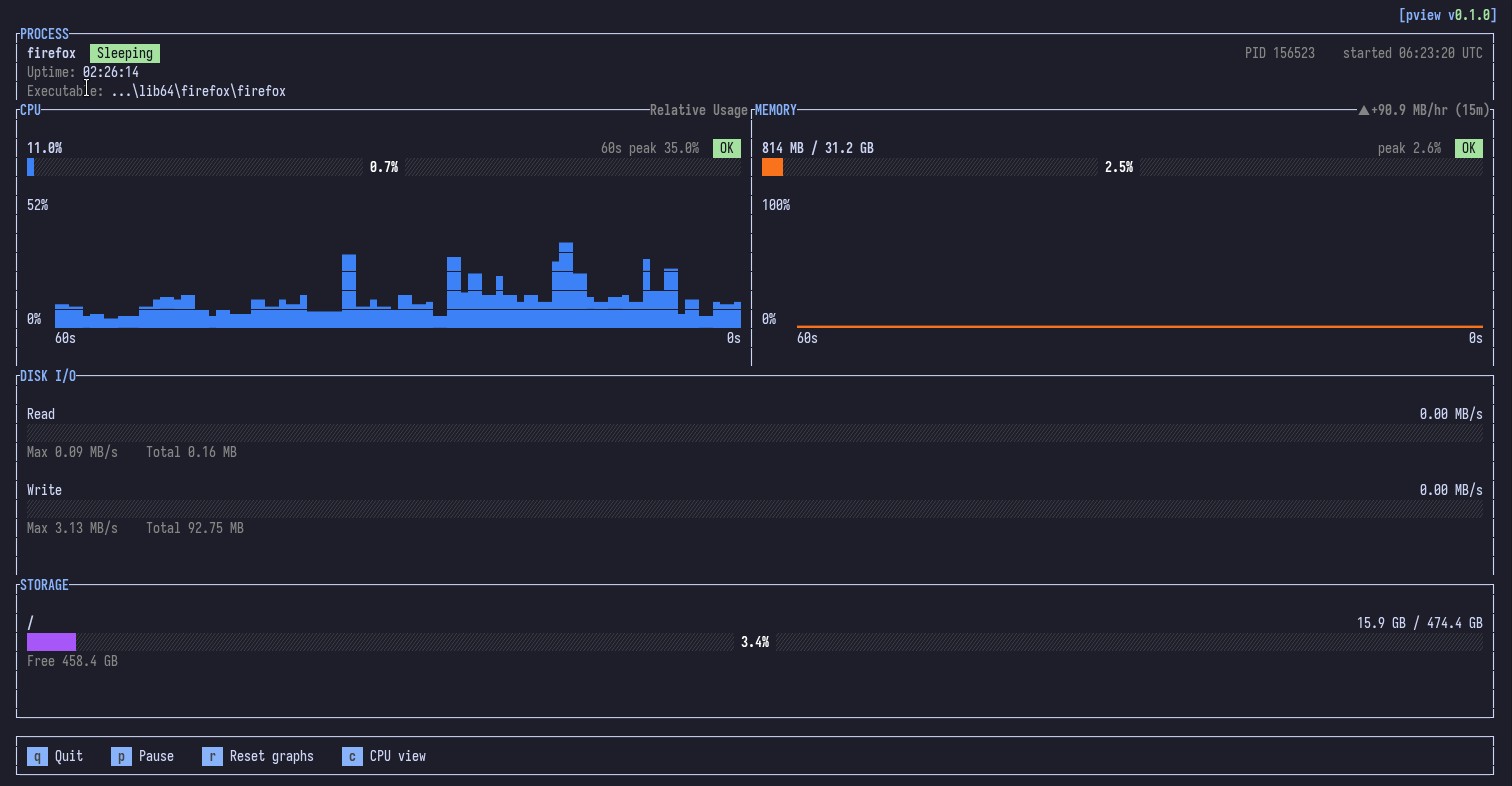
pview is a terminal UI scoped to exactly one process. It draws live sparkline graphs for CPU and memory, each shown as a percent of total system capacity, with a peak-since-start reading and an OK/HIGH/CRIT badge. There are disk I/O and storage gauges and process metadata too, and the refresh rate is configurable from 250ms to 1s.
A few of these details only showed up after I’d been staring at the graphs for a while. The CPU panel cycles between three views (percent of one core, cores used, usage relative to the recent peak) because what counts as “normal” depends a lot on how you frame it. There’s a memory trend badge (▲/▼/► ±X MB/hr) that tracks drift over the last hour, so a slow leak shows up without you having to watch the graph and do the math yourself. There’s also a pause/reset control, so you can freeze the display to inspect a moment or start a fresh graph window without restarting.
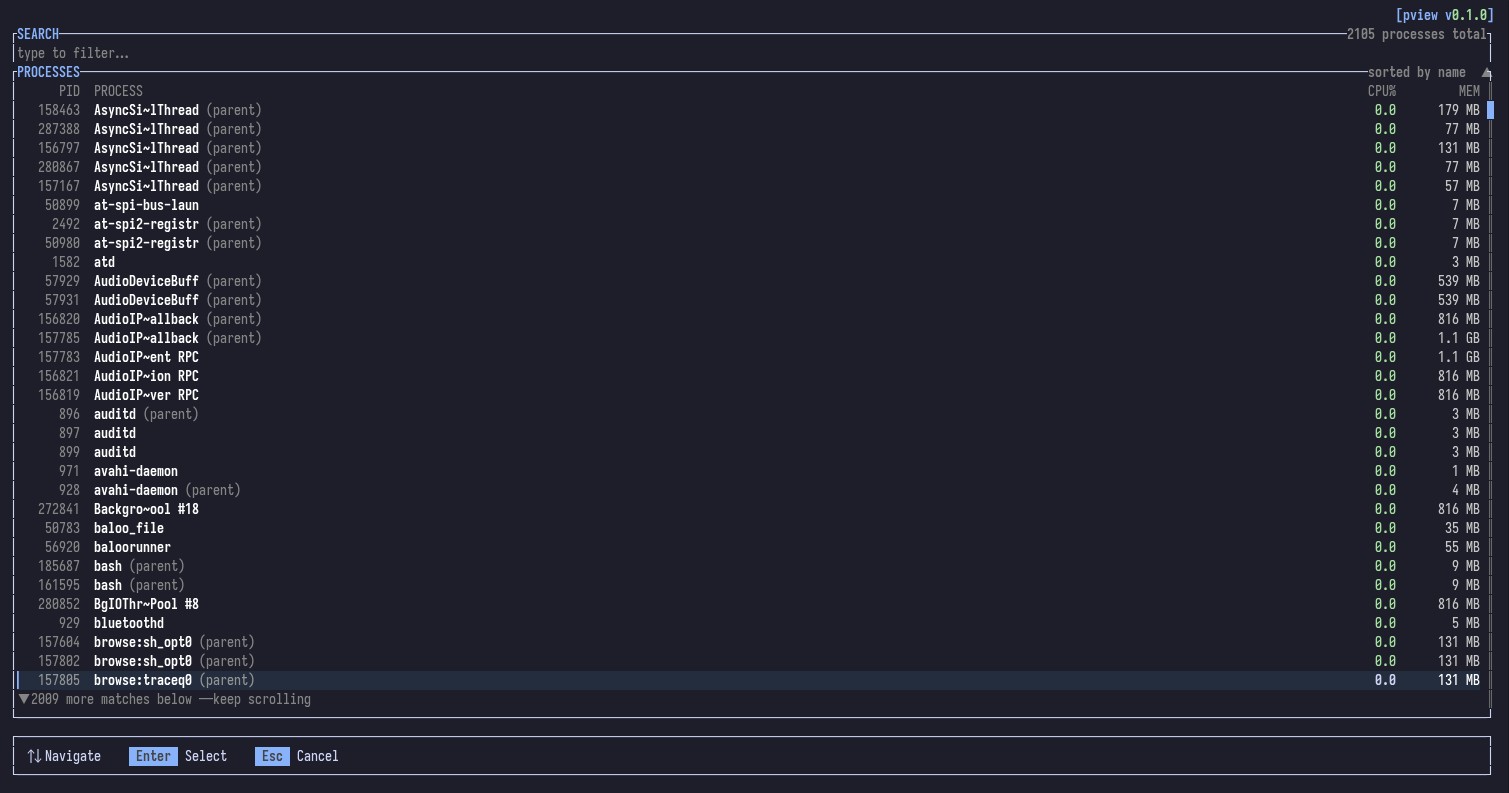
If you don’t remember the exact process name or PID, run it with no arguments and a fuzzy-search picker lists every running process with live CPU and memory. It sorts alphabetically by name on purpose, so rows don’t jump around as usage changes.
Using it
You need a recent Rust toolchain, then:
git clone https://github.com/Blathe/pview.git
cd pview
cargo build --release

pview                       # fuzzy-search picker
pview explorer.exe          # by process name
pview 12345                 # by PID
pview explorer.exe -i 250   # refresh every 250ms
If a name matches more than one process, pview opens the picker pre-filtered to what you typed. Inside the dashboard, q quits, p pauses, r resets the graphs, and c cycles the CPU view.
How it’s built
Rust, using ratatui for the UI, crossterm for the terminal backend, clap for argument parsing, and sysinfo for cross-platform process stats. I mostly built and tested this on Windows, and I’ve run it on Linux too (the screenshots here are from Linux). Some fields like disk I/O or process start time might not show up for processes you don’t own unless you’re running elevated.
Building it with Claude
Claude wrote most of the code. My part was designing what the tool should show, reviewing what came back, and asking it to explain any Rust I didn’t understand as I read through it, which is how I learned most of what I know about the language so far. When something wouldn’t work, I had it walk me through its debugging process, which was often more useful than the fix itself.
It was good at writing Rust that was optimized and easy to read. The terminal UI was a different story: it struggled with layout until I put a design system in place for the panels, colors, and spacing, and then had it follow that. Giving it constraints to imitate worked much better than describing what I wanted in the abstract.
What was hard
The hardest part was deciding how to present the data so it made sense to a person without breaking the layout in a terminal. Every number has to fit in a fixed grid of characters, and a graph that’s useful at one terminal size can fall apart at another. The three CPU views and the “percent of total capacity” rule came out of that.
The other big one is platform differences. Windows and Linux report process details differently, and I had to account for those gaps rather than assuming every field exists. That work isn’t finished.
What’s next
I haven’t touched it in a while, but there are a few things I’d like to add: more detailed memory views like swap, and some profiling features, where you could log a session, watch a process for a period of time, and generate a report afterward. More Windows and Linux cleanup is on the list too.
Code on GitHub.
Button not opening your mail app? Write to scottpeters2281@gmail.com.